Nitinkumar Kademani
PG190631
The segment ‘quarry simulation’ focuses on simulating a blast on the present conditions of the basalt quarry. This process aims at studying the newly formed topology in the blast region. Further, spatial systems are studied from the plans and sections that are extracted across the blast site. Blender and Rhinoceros-3D are used in simulating and documenting the blast.
SIMULATING THE BLAST

2. The site mesh is then split into two, to focus the study on the higher altitude region in the location.
3. With the help of the ‘Cell Fracture’ tool in Blender, the study area is fractured into ‘Voronoi’ cells. The fracture is determined by the number of cells, scale, and noise factor. In the beginning, the cell number is raised to 1000, with a uniform of scale of 1 across the three axes and a noise factor of 0.3.

5. With the peripheral cells intact, the remaining cells are further fractured by 600 units with a noise factor of 0.3, and a uniform scale of 1.
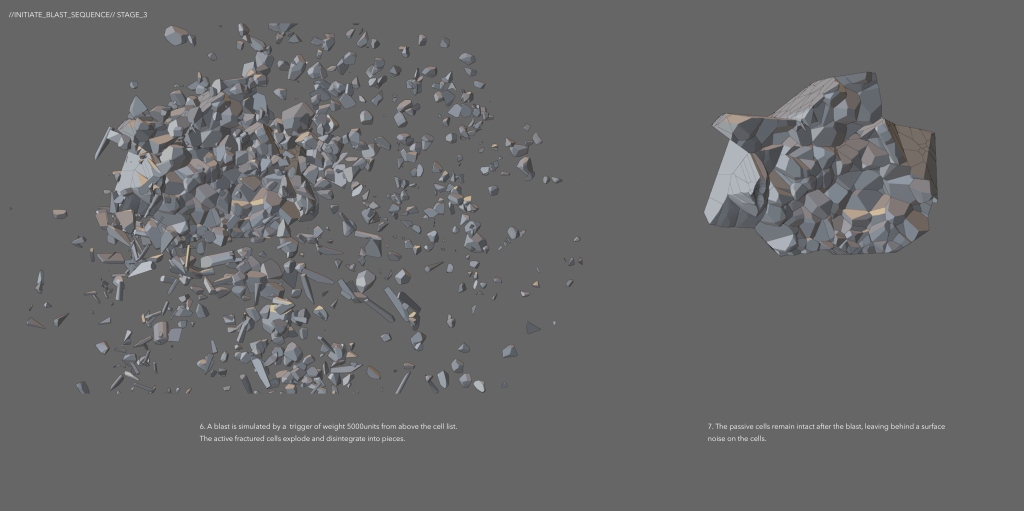
7. The passive cells remain intact and are left behind with a noise on the surface due to the blast.

9. The blast leaves behind a niche in the list of periphery cells. The surfaces on the niche are more fractured and noisy after the impact.
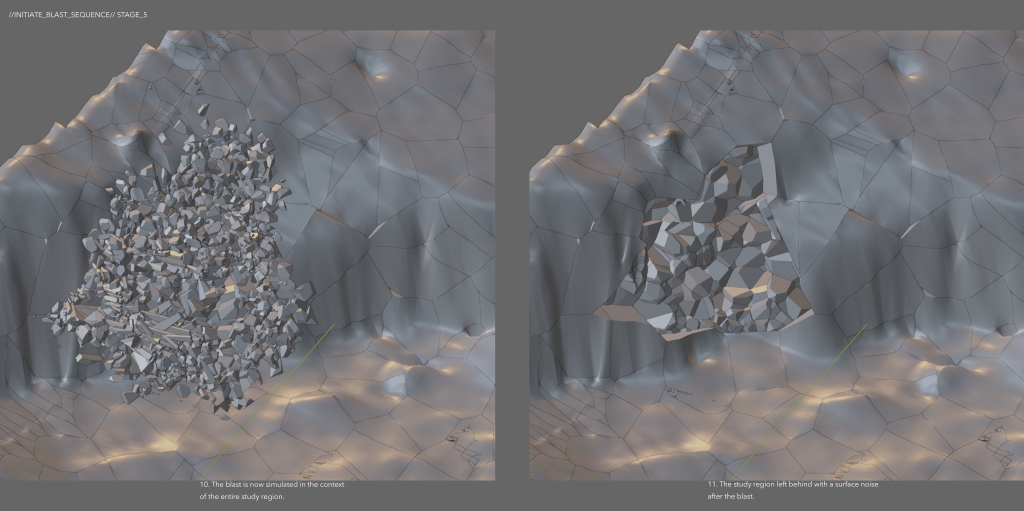
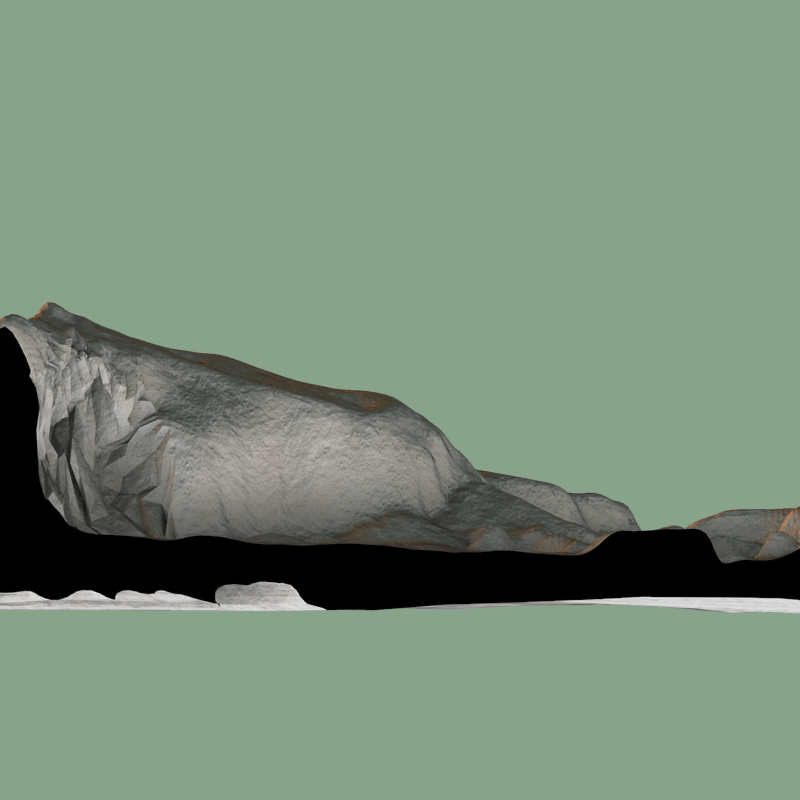
11. Here the niche is visualized in the larger context of the site as it appears.

13. Here the niche is visualized in the larger context of the site as it appears.
The following images present the before and after blast-stages on the site. The newly blasted cellular region is later re-topologized for optimal mesh configuration, This is done to visualize the study region as a non-cellular coherent mesh.
SPATIAL SYSTEMS

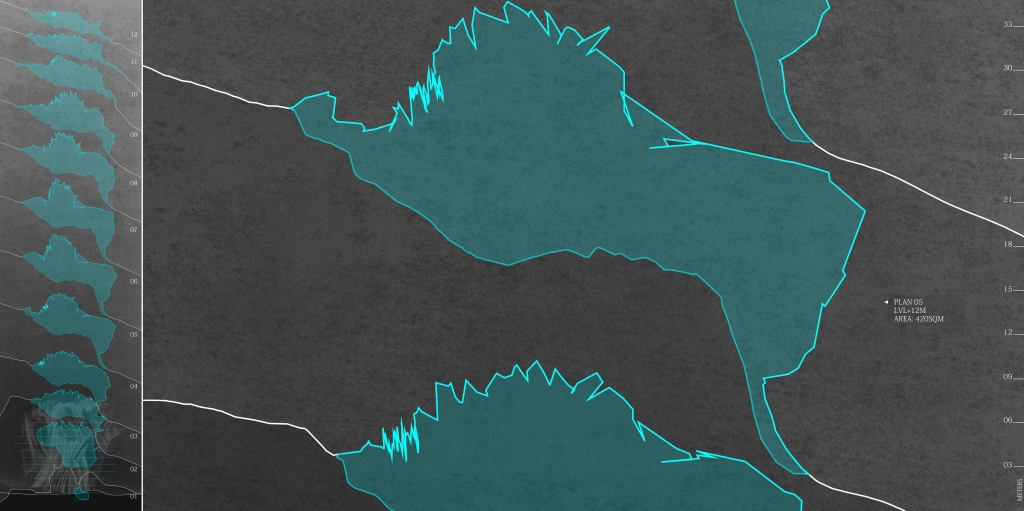
The panel on the left presents the entire list of plans extracted as part of the study. The plans in detail are viewed to further understand the changing profiles of the blast surface.


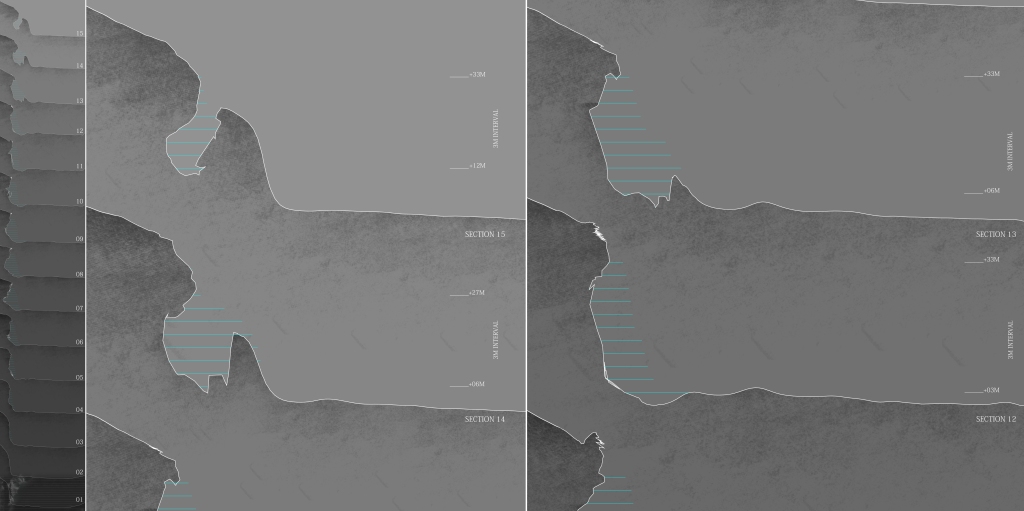
The next set of drawings observes a series of sections cut across the blast region. Thus, 15 sections are extracted at 3meter intervals. The deepest surface available after the blast is ~21.45meter, as measured from the older contour a volume of ~9659m3 is estimated to have been carved out of the site after the blast.

The panel on the left presents the entire list of sections extracted during the study. The changing profile of the blasted surface is visualized through enlarged drawings of the same on the right panels.


Sections across the blast region.

This speculative study serves the purpose of understanding the blast that occurs in the basalt quarry. The simulation process also allows to read the difference in surfaces, between the older, weathered and smoothened profiles to the newly formed noisy and jagged edged ones. Thus, both the conditions are visualized simultaneously in the series.
